pproved Short Sales in Folsom!
- Filter by
- Categories
- Tags
- Authors
- Show all
- All
- Dave Ramsey
- Home Buying Tips
- PROBATE REAL ESTATE LEARNING CENTER
- Real Estate Economic News
- Sacramento Real Estate
- Save Your Home- Foreclosure Prevention
- Selling your home
- All
- "paid as agreed" from a short sale
- "save" your home
- "So How Do I Short Sale My Sacramento Area Home?"
- "what documents needed to complete a short sale?"
- “2015 Remodeling Impact Report
- “Remodeling Impact Report”
- ”
- (HAFA cash for keys
- (Senate Bill 931)
- $1000 per short sale
- $3000 HAFA incentive to Borrowers f
- $3000 HAFA payment to assist with relocation expenses
- $3000 HAFA relocation expenses
- $3000 in Borrower Relocation Assistance
- 000 homeowner incentive short sale government
- 000 In Cash For Keys (Relocation Assistance)
- 10.47 percent of Sacramento area homes headed to foreclosure
- 2017 California Disclosure Requirements
- 2017 California Natural Hazard Disclosure Report
- 2017 California Seller Disclosure Requirements and Disclosure Documents
- 2017 Califronia Transfer Disclosure Statement
- 2MP... Government Programs
- 2nd Lien Modification Program (2MP) harp
- 401(k)/Retirement Loan for down payment
- 5 aspects of a Great Agent
- 5 house-hunting tips
- 5 things that you should consider while working with an agent.
- 5 TRAITS OF A GREAT REAL ESTATE AGENT
- 5 Traits To Look For
- 5 Traits To Look For in The Right Agent
- 6 Best Improvement Projects
- 90-day delinquency
- 916-316-3810
- 948 John Murray Way
- 95834
- A great agent is always worth more than what they charge
- A great agent will have great past results
- A Great Agent Will Have Much Experience
- a Sacramento area Short Sale relocation assistance
- A Shift in the Real Estate Market
- A-REO
- about HAFA
- Absorption Rate
- Absorption Rates
- According to the Congressional Oversight Panel
- Active Short Contingent
- Active Short Sale
- Active Short Sale Contingent
- active short sales
- Active short sales in El Dorado County
- actual california foreclosure processing time
- additional Loan Modification information
- administrator.
- advantage of a short sale
- advantages of a short sale over foreclosure
- Affordable Entry Level Housing in Sacramento
- agent specialize in Short Sales
- agents in Folsom HAFA Certified
- aggressively pursue homeowners
- almost 9 percent are behind
- Alt-A market
- alternatives to foreclosure
- alternatives to foreclosure such as HAFA
- Am I Eligible for HAFA?
- Am I HAFA Eligible?
- am i in Foreclosure?
- and closings
- And Master's Club Life Member
- and the surrounding communities of Orangevale
- Another Successful Short Sale in Folsom!
- Anti Foreclosure and Short Sale programs
- anti-deficiency protection
- Anti-Foreclosure Option to Folsom Homeowners
- antifraud protections
- Approval Letter
- approval letter from Bank Of America
- approval letters coming from Bank of America.
- approval of short sale files
- approve you for a short sale
- approved short sales
- Approved Short Sales Natomas
- April Loan Mod Report
- April Program
- Archive for the 'HAFA GUIDE AND HAFA NEWS' Category
- are short sales possible
- Are There Successful Loan Modification Strategies?
- are we candidates for a short sale?
- Aspects of a Great Agent
- Assembly Bill 278
- auction for foreclosure sales in Yolo Couny
- Aurora
- Average Foreclosure Time In West Sacramento
- average time between notice of default and trustee sale in California
- average time to do a short sale
- average time to foreclose in Folsom
- average time to foreclose in Sacramento County
- Avoid California deficiency
- Avoid Deficiency Judgement in California
- avoid foreclosure
- Avoid Foreclosure in Sacramento
- B of A
- back to the bank
- back to the bank in folsom
- bad home loan situation
- bail out acronyms
- Bail-out Acronym Soup
- BAILOUT ACRONYM SOUP
- ban creditors from seeking so-called deficiency judgments from
- ban foreclosure dual tracking
- bank
- Bank America and Equator
- Bank America cannot pursue a deficiency judgement.
- Bank America HAFA program
- Bank America Short Sale
- bank america short sale transactions
- bank approves the short sale
- bank Bank of America short sale in folsom
- Bank of America
- Bank of America announced in March its commitment to participate in HAFA
- Bank Of America As Second Lienholder
- bank of america short sale
- bank of america short sale approval letter without deficiency
- bank of america short sale deficincy letters
- Bank of America short sale in Folsom approved in Seven Days!!
- bank of america short sale processing system
- Bank of America Short Sale Relocation Assistance
- Bank of America Short Sale Relocation Assistance Program
- bank of america short sale system
- Bank Of America To Start Foreclosures Again
- Bank Of America's Equator System And The HAFA Program...
- Bank of America's HAFA website
- Bank of America's Short Sale Program
- Bank of America's Short Sale System
- Bank of Americas and the HAFA program on Equator
- bank or servicer short sale approval
- Bank Owned Foreclosures
- bank owned homes
- Bank Owned properties in Folsom
- banks receive more on their investment through a short sale
- banks supporting hafa
- Bath Design Trends
- bathroom remodels
- bbofa hafa program
- Be an informed buyer
- beautifully conditioned the home to sell
- before they decide to do a short sale
- Beginning of the California Foreclosure Process
- behind on mortgage payments
- benefit of a short sale over foreclosure
- Benefits of a Short Sale
- BENEFITS OF COMPOSTING
- benefits of doing a short sale in Folsom
- benefits of doing a short sale in West Sacramento
- Benefits of HAFA
- Benefits of short sale
- best agents in your marketplace
- Best hardship letter
- best long-term remodeling investments
- Best ROI Home Improvement Projects
- best short sale agent in Folsom
- best short sale information in sacramento area
- best value
- best value for your home
- between foreclosure short sale
- BofA
- bofa equator short sale
- BofA equator system
- BofA Resumes Foreclosures
- BofA Short Sale Processing System
- boom
- borrower does not qualify for HAMP.
- BPO fraud
- Broker Price Opinions
- Buy
- buy a home
- buy a short-sale property
- buyer commitment on my short sales
- buyer's market in Sacramento
- buying a home
- Buying a Home in Sacramento
- Buying A Short Sale
- Buying foreclosures
- buying short sale in sacramenot
- Buying Short Sales
- CA
- CA Certified HAFA Specialist
- CA HAFA Specialist
- CA homeowners packet
- CA Short Sale
- CA Short Sale Expert
- Califormia recourse on foreclosed second
- California
- California 2017 Disclosure Requirements
- California anti deficiency and anti recourse law
- California anti deficiency law
- california anti-deficiency protection
- California Civil Code
- California Civil Code Section 1102
- California Civil Code Section 1103
- California Deed Of Trust
- California Deficiency Judgement
- california deficiency judgment
- California Deficiency Law
- California defieciency law
- California Department of Real Estate
- California Disclosure
- California Disclosure Documents Avalible
- California Disclosure Requirements for 2017
- California Forclosure activity
- California Foreclosure Activity
- California Foreclosure Activity Drops
- California foreclosure deficiency
- California Foreclosure Law
- California Foreclosure Law Here
- California foreclosure laws
- California Foreclosure Process
- California Foreclosure Processing Time
- California Foreclosure Report
- California Foreclosure Report for May 2010:
- California foreclosure tax
- California Foreclosure time lines
- California Foreclosure Time lines And California Short Sale Time lines.
- California Foreclosure Timelines
- California foreclosure timetable
- california foreclosures and short sales
- California Gov. Arnold Schwarzenegger
- California Homeowner Bill of Rights
- California homeowners
- California Housing Affordability
- California is up 58 percent in Bank Repossessions
- California law provides a tax break
- California Mortgage Debt Relief
- California Mortgage Debt Relief Act
- california mortgage relief tax
- California Natural Hazard Disclosure Report
- California Natural Hazard Disclosure Statement
- California Natural Hazard Disclosure Statment
- California Notice Of Default
- California passed a new foreclosure timeline law in 2008
- California Real Estate Disclosures
- California Real Estate Law
- California Required Disclosure
- California Second Mortgage Recourse
- California Short
- California Short sale
- California Short sale deficiency
- California short sale deficiency law
- California Short Sale Deficiency Laws
- California Short Sale Recourse Law
- California Short Sale Tax
- California Short Sale Tax laws
- california short sale timelines
- California Short Sales
- California Short Sales 2015
- California short sales and foreclosures
- California short sales and foreclosures up 2.2 percent Q1 2015
- California short sales experienced the largest increase in 3 years
- California Short Sales/REOs increase
- California State Foreclosure TimeFrames
- California state law regarding short sales
- California state laws that protect defaulted homeowners
- California state Taxes after short sale
- California State Taxes on a Short Sale
- California tax law regarding short sales
- California Transfer Disclosure Statement
- California will not forgive Mortgage Debt Relief
- California-Short-Sale-Mortgage-Debt-Relief
- California's Deed of Trust
- California's Foreclosure numbers
- California's Foreclosure Timelines
- California's Mortgage Debt Relief Act
- California's new anti deficiency law
- California's new short sale anti deficiency law
- California's Newest Anti-Recourse
- Californians facing foreclosure
- Califronia Transfer Disclosure Statement
- Call Today! 916-316-3810
- cam I do hafa
- Cameron Park
- Cameron Park 95682 Short Sale Information
- Cameron Park Short Sales
- campaign Codes
- Can I do HAFA?
- can I qqualifry for a short sale
- Can I qualify for a short sale?
- Can I short sell my Folsom Home
- can I short sell my home
- Can I Short Sell My House Here In Folsom
- Can I Short Sell My House In Folsom
- Can I stay in my home after a short sale?
- Can My Second Lender Come After Me After A Short Sale In California?
- Can my second lender come after me in California Short Sale
- Can My Second Loan Sue Me?
- Can My Second Mortgage Come After Me After I Do A Short Sale?
- can Short Sale on your Folsom home
- Can the bank come after you for the difference after a short sale
- can we qualify for a short sale in El Dorado Hills?
- Can you do a Short Sale in Probate?
- Can you sell your own home?
- Can You Short Sale your Home With A Chase Loan
- Cancellations
- cash for avoiding foreclosure
- Cash For Keys with HAFA's Short Sale Program
- CDPE
- CDPE Folsom
- CDPE-designated agents
- CDPE: Does Your Agent Specialize In Short Sales?
- Cerfified Residential Specialists
- Certifed HAFA Specialist
- Certified Distressed Property Expert
- Certified Distressed Property Expert CDPE
- Certified Distressed Property Expert Designation
- Certified El Dorado Hills
- Certified ELP Local Provider
- Certified Expert Short Sale Negotiator Forth Hoyt
- Certified Folsom
- Certified folsom short sale specialist
- Certified Foreclosure Options Expert
- Certified Foreclosure Options Specialist
- Certified Foreclosure Prevention Expert
- Certified HAFA
- Certified HAFA Agent Certified HAFA Agent in Folsom
- Certified HAFA Expert
- certified HAFA short sale
- Certified HAFA short sale expert
- Certified HAFA Short Sale Specialist
- Certified HAFA Short Sale Specialist Forth Hoyt
- Certified HAFA Speciaist Designation from C.A.R:
- Certified HAFA Specialist
- Certified HAFA Specialist (CHS)
- Certified Hafa Specialist Designation
- certified hafa specialist sacramento
- Certified Probate Expert In Sacramento County
- Certified Residential Specialist (CRS)
- Certified Sacramento
- Certified Sacramento area short sale expert Forth Hoyt
- Certified Sacramento HAFA Short Sale Expert
- Certified Sacramento Short Sale
- Certified Sacramento Short Sale Agent
- Certified Sacramento short sale specialist
- Certified Sacramento Short Sale Specialist Forth Hoyt
- Certified Sacramento Short Sale Specialist Reports
- Certified Short Sale
- Certified Short Sale Agent
- certified short sale designations
- Certified Short Sale Expert
- Certified Short Sale Expert and Short Sale Specialist
- Certified Short Sale Expert Forth hoyt
- Certified Short Sale Expert in Sacramento
- Certified Short Sale Expert Sacramento
- Certified Short Sale Expert Talks
- Certified Short Sale Negotiator
- certified short sale negotiator Forth Hoyt
- certified short sale professional
- Certified short sale specialist
- Certified Short Sale Specialist Forth Hoyt
- certified short sale specialists
- Certified Specialist
- Certified to Short Sale Sacramento
- cetu deed in lieu
- changes in disclosure requirements
- changes made to the California foreclosure timeline
- changes to HAMP
- Chase
- Chase Bank Has a New Short Sale Outreach Program
- Chase has announced their support of HAFA
- Chase loans originated by Washington Mutual
- Chase Outreach Short Sale Program
- Chase short sale
- Chase short sale outreach
- choosing a great agent.
- choosing a loan
- Choosing an agent
- Choosing the right type of home loan
- Choosing Your Home Loan
- Citi
- citi hafa program
- Citibank
- Citibank begins new Foreclosure Alernative program
- Citibank Foreclosure Alernatives
- Citibank is participating in HAMP
- CitiMortgage anti-foreclosure
- Citrus Heights real estate
- Citrus Heights Short Sale Chart
- Citrus Heights short sales
- Citrus Heights Zip codes
- civil code 580 non recourse second
- Civil Code of Procedure 580
- Civil Code of Procedure 580 (d)
- Civil Code of Procedure 580 (e)
- Civil Code Of Procedure 580(e)
- Civil Code Section 580e
- Close Short Sales
- closed more short sales
- closed short sales
- closed short sales in Folsom
- closed short sales in Orangevale
- cma
- come painted
- Come Up with a Down Payment
- commencing modifications
- commission amounts
- Common Questions About Foreclosure Time Lines In California
- Commonly known as the Short Sale Package
- Community Facilities Act of 1982
- comparative market analysis
- Comparative Market Analysis (CMA)
- Complaints to HAMP
- complete a short sale
- Compost
- Composting
- condition your home to sell
- Congressinal Oversight Panel
- Congressional Oversight Panel's
- connect with an agent
- considered for HAFA
- Considering a Short Sale in El Dorado
- Considering a Short Sale in Placer County?
- Considering a Short Sale in Sacramento
- contact a lender
- Contact us Today At Forth Hoyt’s Sacramento Short Sale Center
- contains deficiency language
- Contemporary and transitional-styled bathrooms
- contingent upon third party approval.
- converting modifications to permanent status
- could I owe taxes on a short sale
- credit affects of short sale
- CRS
- CRS in the SACRAMENTO
- Dave Ramsey
- Dave Ramsey ELP
- Days on Market
- Days on the Market
- debt forgiveness
- Decide on a Home Loan.
- decline in household income
- Deed In Lieu of Foreclosure
- deed in lieu on steroids
- deed of trust
- Deed Of Trust VS Mortgage
- Deed-In-Lieu
- deed-in-lieu arrangement
- Deed-in-Lieu of Foreclosure is recorded exactly as a foreclosure
- Default to the actual trustee sale. How Long is the Foreclosure Process in Sacramento?
- Deficency Judgements
- Deficency Judgements For Refinanced Homes
- deficiencies after a short sale
- deficiency
- deficiency action from first mortgages
- Deficiency for short sales in California
- deficiency in a short sale
- deficiency information
- deficiency judgment
- deficiency judgment california short sale
- deficiency judgment coming from any junior lien holder
- deficiency judgment in California.
- Deficiency Judgments
- Deficiency Judgments After a Foreclosure
- Deficiency Judgments After a Short Sale
- Deficiency Judgments and California Law
- deficiency judgments of non-recourse loans in California short sales
- Deficiency Judgments on short sales
- Deficiency Judgments with Full Recourse
- deficiency language from Bank of America
- deficiency law
- deficiency liability
- Deficiency on junior lien
- Deficiency on second loan
- Deficiency Protection After Short Sale
- Deficiency Protection For Sacramento Short Sales
- deficiency recourse claims from a short sale
- Deficiency second mortgage
- deficiency waivers
- defieciency law as it raleates to short sales and foreclosures in California.
- denied a HAMP loan modification
- department
- details on the HAFA process
- difference between a mortgage and deed of trust
- difference between a short sale listing and a regular "Equity Sale"
- difference foreclosure short sale
- differences between a foreclosure and a short sale
- differences between a foreclosure and a short sale on your credit rating
- Directive 11-02
- directive 1102
- Disclosure Documents
- Disclosure Requirements
- Disclosure Requirements for California
- Discover Which Loan Program Works Best
- distressed sales
- Do A Short sale
- Do I have a hardship for a short sale?
- do it yourself Loan Mod Kit
- Do not sign over the deed
- do-it yourself loan modification checklis
- Document Required by Law
- Documents Are Required For A Short Sale
- documents in a short sale package
- Documents Needed for a Home Loan
- Documents needed for a loan modification
- Does Fannie or Freddie Own My Loan?
- doing short sale
- down payment
- down payment for your dream house
- down payment for your house
- down to earth
- Dual track foreclosure
- Dual tracking
- Dual tracking ban
- e-PRO
- easy
- educated short sale real estate agent
- educated short sale real estate professional
- El Dorado and Placer Counties
- El Dorado County
- El Dorado County Foreclosed homes
- El Dorado County Foreclosure Market
- El Dorado County homeowners are struggling
- El Dorado County short sale closings
- El Dorado County short sale closings are increasing
- El Dorado County Short Sale Statistics
- El Dorado Hill Short Sales
- El Dorado Hills
- El Dorado Hills and the Sacramento area.
- El Dorado Hills Certified HAFA
- El Dorado Hills Certified HAFA Specialist
- El Dorado Hills Expert Short Sale Negotiator
- el dorado hills foreclosure info
- El Dorado Hills HAFA Short Sales
- El Dorado Hills homeowners in Foreclosure
- El Dorado Hills homeowners not yet in Foreclosure
- El Dorado Hills Multi-Certified Short Sale Specialist
- El dorado Hills real estate
- El Dorado Hills Short Sale
- el dorado hills short sale agent
- El Dorado Hills Short Sale Approvals
- El Dorado Hills Short Sale Expert
- El Dorado Hills Short Sale Expert Negotiator
- El Dorado Hills Short Sale Info
- El Dorado Hills Short Sale Information
- El Dorado Hills Short Sale Information By Short Sale Specialist
- El Dorado Hills short sale market
- El Dorado Hills Short Sale Relocation Assistance
- El Dorado Hills Short Sale Specialist
- El Dorado Hills Short Sale Success Rate
- El Dorado Hills Short Sales
- El Dorado Hills Short Sales Increasing
- el dorado hills sort sale info
- El Dordo Hills
- El dordo hills short sale information
- Eligibility for HAFA Short Sale Program
- eligible for government programs
- eligible for HAFA
- Elk Grove
- Elk Grove and West Sacramento
- Elk Grove CA Certified HAFA Short Sale Specialist
- Elk Grove CA Short Sale Expert
- Elk Grove HAFA Short Sale Expert
- Elk Grove short sale specialist
- Elk Grove Short Sales
- Elk Grove's Active Short Sale inventory
- Elk Grove's Certified HAFA Short Sale Specialist
- Energy efficiency
- equator
- Equator and HAFA
- equator generic negotiator
- equator HAFA codes
- Equator is a technology platform. They are the leader in automating the Default industry. They are the chosen platform for 17 of the top 25 lenders nationwide and have handled over 63 million transac
- Equator operator
- Equator Short Sale System
- Equator system
- Equator technology platform.
- ertified Short Sale Negotiator Forth Hoyt
- escrow delays
- Estate has property that needs to be sold
- et the probate process started
- evaluated for HAFA
- evolution of internet and real estate
- evolution of the short sale
- ew Government HAFA program
- Example Hardship Letters
- Execute A Probate In California
- Execute a Will Through Probate
- Executor and Personal Representative
- Executor and/or Administrator
- Executor of a will is the same as Personal Representative
- Executor of will the same as Personal Representative
- Experienced Folsom Short Sale Specialist
- Experienced Real Estate Agent
- Experienced Sacramento Area Short Sale Negotiator
- Experienced Short Sale Agent
- Expert and Short Sale Specialist
- Expert Explains Probate
- Expert Folsom Area Short Sale Negotiator
- expert folsom short sale agent
- Expert Sacramento area Short Sale Negotiator
- Expert Sacramento Short Sale Negotiator
- Expert Short Sale
- expert short sale agent in Folsom
- Expert Short Sale Negotiator
- Expert Short Sale Negotiator And Certified Short Sale Specialist Helps FanmiliesAvoid Foreclosure In Folsom
- Expert Short Sale Negotiator Forth Hoyt
- explain foreclosure
- explain the California Deficiency Law
- explain the HAFA program
- explain the HAFA progrm
- extended foreclosure time lines
- extended foreclosure time lines in California
- Extensive Short Sale Agent Experience
- Extensive Short Sale Training
- failed or delayed Short Sale closings
- failure of HAMP
- fair market price
- Fair Oaks
- Fair Oaks Area Short Sale Specialist
- Fair Oaks short sale
- Fair Oaks Short Sale Specialist
- Fannie and Freddie' HAFA program
- Fannie Mae and Freddie Mac
- Fannie Mae and Freddie Mac servicers
- fannie mae hafa
- Fannie Mae is not even participating in HAFA
- Fannie Mae or Freddie Mac
- Fannie Mae's AlternativeModification
- Fannie Mae's HAFA
- Fannie Mae's HAFA Guidelines
- Fannie-Mae and Freddie Mac loan modification forms
- fastest short sale
- FEBRUARY LOAN MODIFICATION REPORT
- FHA Pre-Foreclosure Sale
- FHA Short Refinance Program
- FHA Short Sale Guidelines
- filing of the Notice of Default
- final Foreclosure auction in Yolo Couny
- financial acronyms
- financial plan
- financial planning
- Financial Statement
- find a short sale agent in folsom
- Find an agent
- Find if the home you are looking at to buy has Mello Roos!
- Find out more about HAFA
- find out whether the bank has started foreclosure
- find your dream home
- finding a home
- first lien with Bank of America
- first loan only
- first-time buyer
- First-time Buyer Housing
- First-time Buyer Housing Affordability
- flopping
- folks have been selling their own real estate since
- Folsom
- Folsom agent who specializes in short sales
- Folsom and El Dorado Hills Area Experienced Short Sale Agent
- Folsom and El Dorado Hills Certified HAFA Short Sale Specialist
- Folsom and El Dorado Hills Short Sale Relocation Assistance
- Folsom and El Dorado Hills Short Sale Specialist
- Folsom Anti-Foreclosure Specialist
- Folsom approved HAFA short sale
- Folsom Area Considering a Short sale
- Folsom Area Short Sale Expert
- Folsom CA
- Folsom ca short sale information
- Folsom ca short sale specialist
- Folsom CA Short Sales
- folsom california
- Folsom CDPE
- Folsom CDPE Agent
- Folsom CDPE designation
- Folsom Certified HAFA Short Sale Specialist
- Folsom Certified HAFA Short Sale Specialist Forth Hoyt
- Folsom Certified HAFA Specialist
- folsom certified short sale agent
- Folsom Certified Short Sale Agent forth Hoyt
- Folsom Certified short sale expert
- Folsom Certified Short Sale Negotiator
- Folsom Certified Short Sale Negotiator Forth Hoy
- Folsom Certified Short Sale Specialist
- Folsom Certified Short Sale Specialist Provide
- Folsom Expert HAFA Short Sale Negotiator
- Folsom Expert Short Sale Negotiator Forth Hoyt
- Folsom foreclosure expert
- Folsom foreclosure options
- Folsom Foreclosure or Trustee Auctions
- Folsom Foreclosure Scams
- Folsom Foreclosure Starts
- Folsom Foreclosures
- folsom HAFA
- Folsom HAFA Certified Short Sale Specialist
- Folsom HAFA short sale
- Folsom HAFA Short Sale Agent
- Folsom HAFA Short Sale Relocation Assistance
- Folsom HAFA short sale Specialists
- Folsom HAFA Short Sales
- Folsom Home in Foreclosure.
- Folsom homeowners
- Folsom homeowners in foreclosure
- Folsom homeowners looking for options
- Folsom Homeowners who do short sales
- Folsom Keller Williams
- Folsom Multi-Certified Short Sale Expert
- Folsom Multi-Certified Short Sale Specialist Forth Hoyt
- Folsom or El Dorado Hills Wells Fargo Short Sale
- Folsom real estate
- Folsom REO properties
- folsom shoirt sale report
- folsom short sale
- folsom short sale agent
- folsom short sale agent specialist
- Folsom Short Sale Agents
- Folsom Short Sale closings
- folsom short sale expert
- folsom short sale expert agent
- Folsom Short Sale Expert Forth Hoyt
- folsom short sale help
- folsom short sale help and information
- Folsom short sale home
- Folsom short sale homeowners
- Folsom short sale incentive
- folsom short sale info
- folsom short sale information
- Folsom Short Sale Market
- folsom short sale pending
- Folsom short sale properties
- Folsom short sale real estate agent
- Folsom short sale realtor
- Folsom Short Sale relocation assistance
- Folsom Short Sale Report
- Folsom Short Sale Seller
- folsom short sale specialist
- Folsom Short Sale Specialist Forth Hoyt
- Folsom short sale Specialists
- folsom short sale statistics
- Folsom Short Sale Statistics for March 2009
- Folsom Short Sale Statistics for March 2010
- Folsom Short sale Stats
- folsom short salecloser
- Folsom Short Sales
- Folsom short sales approvals
- Folsom Short Sales Are Closing!
- folsom short salfolsom short sales
- Folsom Short Seller's agent
- Folsom Short Specialist
- Folsom shortsale real estate agent
- Folsom Wells Fargo Short Sale
- Folsom's #1 certified short sale agent
- Folsom's HAFA Certified
- Folsom/El Dorado Hills Wells Fargo Short Sale
- for a long
- For sale By Owner
- for text: Can you sell your own home? Why
- Forebearance agreement
- foreclosed home
- foreclosed home goes back to the bank or to an investor
- foreclosed homes sold as REO in El Dorado County
- Foreclosucomplete a short sale
- Foreclosure
- foreclosure activity in Folsom
- Foreclosure Advice
- Foreclosure Advide
- foreclosure alternative
- Foreclosure Alternatives
- Foreclosure Alternatives available to homeowners today.
- Foreclosure Alternatives Program
- foreclosure alternatives under HAFA
- foreclosure and sold as an REO
- foreclosure auction
- Foreclosure auction in Sacramento County
- Foreclosure auction in Yolo County
- Foreclosure Auction Trustee Sale
- Foreclosure Avoidance
- Foreclosure Avoidance and Short Sales
- foreclosure avoidance in folsom
- Foreclosure Avoidance Options
- Foreclosure Cancellations
- Foreclosure Cancellations way up in Sacramento
- foreclosure consultants
- Foreclosure data
- foreclosure deal
- foreclosure decisions
- Foreclosure deficiency law California
- foreclosure fime lines and dates in California
- foreclosure glossary
- Foreclosure Iformation For California
- foreclosure in El Dorado County
- Foreclosure Information for California
- Foreclosure investors
- foreclosure lawsuits
- foreclosure market
- Foreclosure markets
- foreclosure moratorium
- Foreclosure Option Specialist
- Foreclosure Options
- foreclosure options certifications
- Foreclosure Options Experts
- foreclosure options for Folsom home in folsom
- foreclosure options in Folsom
- foreclosure or even loan modification
- Foreclosure or short Sale in Sacramento?
- Foreclosure or short Sale?
- Foreclosure or Trustee Sale Date
- Foreclosure Prevention
- Foreclosure Prevention program
- foreclosure process
- foreclosure process in El Dorado County
- foreclosure process is taking in all of Sacramento
- foreclosure process time lines
- foreclosure process timelines
- foreclosure process to be completed in Sacramento
- foreclosure professional
- foreclosure rate
- Foreclosure recourse california
- Foreclosure Sale
- Foreclosure Sale Date
- foreclosure sale date can be postponed
- foreclosure sale date can be postponed with a Short Sale
- foreclosure sale date can be re-scheduled
- Foreclosure Sale Dates Are Normally Postponed
- foreclosure second mortgage california recourse
- foreclosure solution
- foreclosure starting point
- foreclosure tax
- Foreclosure Time
- foreclosure time clock
- Foreclosure time frames
- Foreclosure Time Frames - Sacramento County
- Foreclosure time lines in El Dorado County
- Foreclosure Time Lines in Folsom.
- foreclosure time lines in Placer County
- Foreclosure time lines in Sacramento County
- Foreclosure Time-Lines
- Foreclosure Time-Lines in California:
- Foreclosure Timeframes
- Foreclosure Timeframes in Folsom
- foreclosure timeframes-folsom
- FORECLOSURE TIMELINE
- Foreclosure Timelines in California
- Foreclosure Timelines in Sacramento
- Foreclosure timelines: California
- Foreclosure Trustee Auction Notices in Folsom
- Foreclosure Truths
- Foreclosurecomps
- foreclosures
- Foreclosures and short sales
- Foreclosures are costly and expensive
- Foreclosures happen
- foreclosures in Folsom
- forgiven debt
- formal start of the foreclosure process; Notice of Default
- formerly REOTrans.com
- forms you will need for a loan Modification
- Forth Hoyt
- Forth Hoyt at 916-316-3810
- Forth Hoyt at 916-316-38110 or [email protected]
- Forth Hoyt CDPE
- Forth Hoyt Certified Residential Specialist
- Forth Hoyt Certified Sacramento Short Sale Agent
- forth Hoyt Probate
- Forth Hoyt Sacramento CRS
- Forth Hoyt's Short Sale Department at The Hoyt Group
- Forth hoyt's Short Sale Division
- Forth Hoyt’s Sacramento Short Sale Center
- fraudulen BPO affecting
- Freddie mac hafa
- Frequently Asked Short Sale Questions
- full settlement language must be included
- Full Short Sale Approval From Bank Of America In Seven Days
- Full Short Sale Approval with Bank Of America!
- Full Short Sale Package
- get a probate started
- Get an appraisal
- Get HAMP Approval
- get started in Short Selling My Home?
- get the best price
- get the best price for your property
- get the greatest value when selling their home
- get your home ready to sell
- Getting A Short Sale Approved
- getting ready to sell your home
- gift letter
- Gift Money for down payment
- GMAC
- Gov. Jerry Brown signed SB 458 (Corbett) into law
- Government Anti Foreclosure Program
- government anti foreclosure programs
- Government Foreclosure Prevention Program Eligibility
- Government Guidelines?
- government hafa program
- Government HAFA Short Sale Guidelines For Sacramento Homeowners
- Government HAFA Short Sale Program
- government incentive
- Government Loan Modification
- Government Options To Help Homeowners
- Government Options to Save YOUR Home
- government policies on short sales
- Government Program HAFA created by the President
- Government Program You Qualify For:
- Government Programs For Underwater Homeowners
- government programs to help homeowners
- government short sale eligibility requirements
- GOVERNMENT SHORT SALE GUIDELINES
- Government Short sale program
- Government Short Sale program: HAFA
- Government Short Sale Programs
- government short sales guidelines
- government sponsored anti-foreclosure programs
- government sponsored foreclosure dela
- Governor Jerry Brown signed into law the Homeowner Bill of Rights
- govetrnment short sale programs
- Granite Bay
- Granite Bay Short Sale
- Granite Bay Short Sale Approvals
- Great Agent
- Great Hardship letter
- Great Short Sale Package
- great short sale transaction
- GSE's have their own HAFA Government Program.
- GSE's to participate in HAFA
- guide to a Loan Modification
- Guide to a Successful Loan Medication
- Guidelines to HAMP
- HAFA
- hafa $3
- HAFA administrators for Bank of America
- HAFA Allows for $3
- HAFA and Equator
- HAFA at Bank of America
- hafa bank america vendors
- hafa bank of america
- hafa banks
- HAFA Benefits
- HAFA borrower Relocation Assistance
- HAFA certified
- HAFA certified agent
- HAFA certified Agent Folsom
- HAFA Certified Agent in Folsom
- HAFA Certified Agents in the Roseville CA Area
- HAFA Certified Short Sale
- HAFA Certified Short Sale Specialist
- HAFA Certified Specialist
- HAFA Certified Specialist Designation
- HAFA Certified Specialists
- HAFA codes
- HAFA Deed-in-Lieu of Foreclosure.
- HAFA Eligibility Requirements
- HAFA eligible
- HAFA Extension and Update
- HAFA from the Obama Administration
- HAFA government
- HAFA Government Guidelines
- HAFA government homeowners assistance
- HAFA government homeowners assistance ($3000)
- HAFA government program
- HAFA government program policies
- HAFA government short sale
- hafa government short sale program
- HAFA government vendor contact information
- HAFA GUIDE AND HAFA NEWS
- HAFA Guidelines
- HAFA Guidelines and Forms
- HAFA Guidelines for Freddie Mac
- HAFA Guidelines Forms
- HAFA has not only been extended
- HAFA help in Sacramento
- HAFA Information
- HAFA is for homeowner occupied
- HAFA is for homeowners
- HAFA is the only program that gives you cash
- HAFA movie
- HAFA Negotiators
- HAFA or The Home Affordable Foreclosure Alternatives Program.
- hafa participating lenders
- HAFA participating servicer
- hafa policies
- HAFA Progam
- HAFA program
- hafa program eligibility
- HAFA Program Information
- HAFA provides financial incentives
- HAFA Provisions
- hafa qualifications
- HAFA Relocation Assistance
- HAFA rules
- HAFA Scams
- HAFA Short
- HAFA short sale
- HAFA Short Sale Agent
- HAFA Short Sale agreement
- HAFA Short Sale and HAFA Deed-in-Lieu of Foreclosure.
- HAFA Short Sale Cash For Keys: $3000 To The Homeowner!
- HAFA Short Sale Facts
- HAFA Short Sale Information in Sacramento
- HAFA Short Sale Negotiatitor
- HAFA Short Sale Negotions.
- HAFA short sale process
- HAFA short sale program
- HAFA short sale program has been Extended to 2013
- HAFA Short Sale Relocation Assistance
- HAFA Short Sale Specialist
- HAFA short sale while current
- HAFA Short Sale's Cash for Keys
- HAFA Short Sale's Cash For Keys Program
- HAFA Short Sales
- HAFA short sales happen more quickly
- HAFA Short Sales in Folsom
- HAFA Short Sales in Sacramento CA
- HAFA Short Sales Sacramento Sacramento
- HAFA specialist
- HAFA Specialist Forth Hoyt
- HAFA speeds up the short sale process
- HAFA the latest government short sale program strictly states that there can be no deficiency language
- HAFA timeframes
- HAFA UPDATE
- HAFA; the last ditch government program
- HAFA's $3
- HAFA's $3000 In Cash For Keys
- HAFA's $3000 in moving expenses!
- HAFA's DIL
- HAFA's DSacramento Certified HAFA Short Sale Specialist Forth Hoyteed in Lieu
- HAFA's Recourse protection
- HAFA's Short Sale Program
- HAMP
- HAMP approval
- HAMP eligibility guidelines
- HAMP eligible
- HAMP fails
- HAMP FEBRUARY LOAN MODIFICATION REPORT
- hamp help in sacramento
- hamp loan mod
- HAMP Loan mod program changes
- HAMP loan modification program
- HAMP Loan Modification Report
- HAMP loan modification statistics
- HAMP loan modifications
- HAMP LOAN MODS
- HAMP long term modifications
- HAMP losn modificatrion success rate
- HAMP modification
- HAMP not working
- HAMP permanent modification
- HAMP program
- hamp program eligibility
- HAMP trial modification process
- HAMP trial period
- handle and process short sales
- hard to find a nice house to buy in Sacramento?
- Hardship for a Short Sale
- Hardship Letter
- Hardship Letter Example
- Hardship Letter Example 1
- hardship letter examples
- Hardship Letter for Short Sale
- hardship letter to the bank
- HARP
- HARP and also 2MP
- hassle of a short sale
- held nearly every business day
- help Folsom Homeowners keep their homes.
- Help Me Do HAFA
- help me with loan modification
- help me with my Sacramento loan modification
- help Sacramento Area Homeowners keep their homes.
- help Stop Sacramento Foreclosures
- HELP WITH MY SHORT SALE
- help with short sale
- help with your probate?
- Here's a summary for HAMP and HAFA:
- High Buyer Expectations
- higher priced short sales
- highest monthly total of foreclosures
- highest return on investment home repairs
- Highest ROI Home Improvement Projects
- highly qualified for a short sale
- Highly Trained Sacramento Short Sale Professional
- hire one of the best agents
- hire one of the best agents in your marketplace
- Hire The Right Agent
- Hiring a professional real estate agent
- his short sale agent
- history of California Short Sale Recourse Law
- history of the internet
- Home Affordability In Sacramento
- Home Affordable Foreclosure Alternative
- Home Affordable Foreclosure Alternatives (HAFA)
- Home Affordable Foreclosure Alternatives (HAFA) Program
- Home Affordable Foreclosure Alternatives Program
- Home Affordable Foreclosure Alternatives Program(HAFA)
- Home Affordable Modification
- Home Affordable Modification Program (HAMP)
- Home Affordable Refinance Program
- Home Affordable Refinance Program (HARP)
- home buyers
- home buying information
- home buying process
- home go to foreclosure
- Home Improvement Projects
- Home improvements
- Home Loan
- home loan delinquencies
- Home loan delinquency rates
- home maintenance item
- Home Purchase
- Home Repairs with highest return on investment
- home search
- Home Specialists
- Homeowner Affordability and Stability Plan
- Homeowner Bill of Rights
- homeowner lawsuits
- homeowner occupied first loansin California
- homeowner occupied qualfies for HAFA
- Homeowner Options
- homeowner options program
- homeowner short sale training
- homeowner to stay in the property
- homeowner to stay in the property after a short sale
- Homeowners and real estate professionals
- homeowners behind in sacramento
- homeowners facing financial hardship can qualify for HAFA
- homeowners Facing foreclosure void paying taxes
- Homeowners keep their homes
- homeowners short sale agent
- homeowners stop making payments
- Homeowners who live in California
- Homeowners who qualify for HAFA
- Homeq
- homes in the Sacramento County
- homes staged before listing sold 90% faster
- hort sale approval process
- hort sale experts
- hort sale help in all Sacramento
- hort sale specialist in the Sacramento area
- house hunting
- house to buy in Sacramento
- Housing Bubble
- housing bubble song
- housing bubble song on youtube
- how California deficiency law affects short sales
- How can I qualify for the $3000 From HAFA
- How Can I stop a foreclosure sale
- How can I stop a Trustee Sale
- how can you be sure you are receiving the best value for your property
- How can you postpone a foreclosure sale date
- How do I do a shorty sale ony sacremto home
- How do I do HAFA?
- How Do I Find A HAFA Agent?
- How do I find out if I'm eligible for HAFA?
- How do I find out if short sale is possible for my home in Folsom
- how do I get in the HAFA program
- How do I get started in Short Selling My Home?
- How do I qualify for HAFA?
- how do I short sale my Folsom home and Stop the Foreclosure
- How Do I Short sell My Folsom Home?
- How Do I Start A Loan Modification?
- How do you do a short sale
- How Do You Do HAFA
- How do you figure taxes on a short sale
- How do you find a Short Sale Specialist in Folsom? Who is the best short sale agent in Folsom
- How do you know if you can short sell you house in Folsom
- how do you know if you qualify for hafa
- How do you know the market has topped?
- How do you maximize the value of a home in a probate sale?
- how does a HAFA Short Sale work?
- How does California Probate Work?
- How Does the HAFA Short Sale Program Help Me?
- How is HAFA different
- How is influencing a BPO fraud
- How Long Can I Stay In MTime to Foreclose in Sacramento County
- How Long Can I Stay In My Home If I Do Foreclosure?
- How long does a short sale take
- how long does foreclosure take in Sacramento
- How long does it take the bank to foreclose?
- how long is it taking for banks to foreclose in Folsom
- How long till the bank forecloses?
- how many more foreclosures
- How much detail should I put in the hardship letter
- How much time do I have in my home?
- how much time does foreclosure take?
- how often are deficiency judgments pursued in california
- how Short Sales Can Keep Homeowners Out Of Foreclosure.
- how short sales work
- how short sales work in Sacramento.
- how Stop Foreclosure With A Short Sale
- How The Short Sale Process Works
- How to avoid deficiency judgement in California
- how to buy a home
- how to buy a short sale
- how to do a short sale
- How to do a short sale on sacramento
- how to Execute a Will Through Probate
- How To Find Mello Roos
- How To Find Mello Roos on a Home
- How to get the Most Money from the Sale of Your Property
- How to get your home ready to sell
- How to HAFA short sale
- how to MAKE YOUR HOME SELL FASTER AND FOR MORE
- HOW TO SHORT SALE
- HOW TO SHORT SALE MY FOLSOM HOME
- how to short sale sacramento area help
- how to short sell
- how to short sell in Folsom
- How To Start A Loan Modification
- How will The California homeowners Bill of Rights help protect homeowners?
- how you can make your showing stand out
- How-To Loan Mod Kit and Successful Loan Modification Report
- HUGE HAFA UPDATE
- I may owe taxes on in a short sale
- I Need To Do A Short Sale
- improvement projects
- In-Depth Do It Yourself Loan Modification Guide
- incentives to banks to participate in HAFA
- increase in 90-day
- increase of short sales in Folsom
- indymac hafa
- INFO FOLSOM SHORT SALE
- Info on short sales
- Information About The Chase Short Sale Outreach Program
- Information For Sacramento Short Sales
- information on California Short Sale Deficiency Law
- information on folsom short sales
- Information on HAMP and HAFA
- information on Sacramento short sales
- Information on short sales
- investigating a short sale
- investor was participating in HAFA
- IRS Form 4506-T Request for Transcript of Tax Return
- IRS taxes and California State Taxes on a Short Sale
- Is compost fertilizer?
- Is compost the same as fertilizer?
- is it worh buying a forclosure in sacramento
- Is My Loan Eligible for HAFA?
- Is Sacramento a Buyers Market or a Sellers Market?
- Is there always a Probate?
- Is there Tax due after a short sale?
- it's a good time to sell
- J.P. Morgan Chase Short Sale Incentive Program
- January Loan Modification Report
- January's short sales
- JP Morgan Chase
- JP Morgan Chase short sale
- JP Morgan Chase short sale outreach program
- junior lienholder
- keep homeowners in their homes
- keep homeowners out of foreclosure
- keeping the foreclosure off the record
- killer short sale file
- killer short sale offer
- Kitchen & Bath Design Trends
- kitchen remodels
- larger deficiencies
- Largest Relocation Assistance Payment
- Largest Relocation Assistance Payment Possible From Wells Fargo?
- Learn what HAFA is
- least expensive home repairs that matter
- legal Foreclosure Time-Lines in California
- legally Required to Disclose
- lender or servicer
- lender recourse for deficiency.
- Lenders and loan servicers participating in HAFA
- lenders participating in hafa
- lenders under hafa program
- lenght of time to foreclose in California
- Length of Time to Move After a Foreclosure
- Length of Time to Move After a Short Sale
- liable for a deficiency judgment.
- Lincoln
- Lincon
- Line of Credit for down payment
- list of hafa banks
- List of Participating HAFA Banks
- Loan Application Questions After a Foreclosure
- loan is non-recourse as a matter of law
- loan is original purchase money
- Loan Mod
- Loan Mod Checklist
- Loan mod for Folsom
- Loan Mod Guide
- Loan Mod How-to
- Loan Modifica scam
- Loan Modification and Foreclosure Prevention
- loan modification checklist
- Loan Modification Guide
- Loan Modification Help
- Loan Modification Help In Sacramento
- loan modification in Folsom
- loan modification instructions
- loan modification or retention programs
- loan modification packet
- loan modification program
- Loan Modification Programs
- loan modification scams
- loan modification strategies
- Loan Modification Tax
- loan modification taxes
- Loan Modification Toolkit
- loan modification trial period
- loan modifications
- loan modifications and REO offers
- loan modifications and short sales
- loan modifications with principle reductions
- Loan modifications work for many borrowers
- Loan Modigication Scams
- loan mods
- LOAN MODS ARENT WORKING
- loan workouts
- long short sale process
- Long Term Modifications
- LONG time. I mean
- Look up Mello Roos
- Look up Mello Roos in Tri Counties
- looking at retirement in a few years and upside down
- looking for a short sale agent in Folsom.
- looking to do a short sale in Folsom
- losses resulting from a short sale
- Maintenance catch-up and touch up before selling
- MAKE YOUR HOME SELL FASTER AND FOR MORE
- make your showing stand out.
- making a decision to do a short sale
- Making Home Affordable
- Making Home Affordable Supplemental Directive 11-02
- Making Home Affordable's
- market value
- Mather
- May Sacramento Short Sale Statistics
- median home price in Sacramento County
- Median Home Price Sacramento
- Mello Roos
- Mello Roos District?
- Mello Roos Information and Quick Search
- Mello Roos on a Home
- Mello Roos Quick Search
- Mello Roos Quick Search and Information
- Mello-Roos tax
- minimum down payment
- modification consultants
- Modification Help
- Modification Help In Sacramento
- Modification News
- Modification Programs
- modified payments
- modify troubled loans
- Monthly payments that are too high
- Months of Inventory Sold Price/Orig List Price
- Months of inventory;
- More HAFA Facts:
- more issues for short sales
- more issues for short sales to be aware of
- More Probate Questions and Answers
- More Questions About HAFA
- More questions on your particular situation?
- Mortage Debt Relief act extended
- Mortgage
- Mortgage Calculators
- Mortgage counselors
- mortgage debt
- mortgage debt forgiven
- mortgage debt forgiveness for California short sales.
- Mortgage Debt Relief
- Mortgage Debt Relief Act
- Mortgage Debt Relief Act of 2007
- Mortgage Debt Relief Extension
- mortgage debt relief law in California
- Mortgage debt relief may be extended
- mortgage debt relief tax
- mortgage debt relief tax in California
- mortgage debt tax
- Mortgage Debt Tax Relief
- Mortgage Debt Tax Relief To Sunset?
- mortgage Delinquencies
- Mortgage Forgiveness Debt Relief Act
- mortgage fraud indictments
- mortgage fraud task force
- mortgage modifications
- mortgage or deed of trust
- Mortgage payment become unaffordable?
- mortgage payment that is uncomfortably high
- Mortgage payment unaffordable
- mortgage problem
- mortgage relief
- mortgage they can no longer afford
- mortgage vs deed of trust.
- Mortgages and deed of trust
- mortgages are non-recourse
- Most Common Questions About Foreclosure Time Lines In California
- Most Money from the Sale
- Multi Certified Folsom Short Sale Specialist Forth Hoyt
- Multi-Certified Short Sale Expert
- Multi-Certified Short Sale Expert Forth Hoyt
- Multi-Certified Short Sale Negotiator
- myths about short sales
- national mortgage settlement
- Natomas
- Natomas and Elk Grove
- Natomas Builders used Wells Fargo
- Natomas Elk Grove
- Natomas Short Sale Expert
- Natomas Short Sale Report
- Natomas Short Sales
- natural gas pipe and propane gas lines
- natural gas pipe and propane gas lines that have rusted.
- Natural gas supply piping and Gas Line Fittings
- negative equity
- negotiate a short sale
- negotiate terms
- negotiated a short sale in Fair Oaks!
- negotiating a short sale
- negotiating second loans in short sales
- neighbothoods in El Dorado Hills
- New Anti-Deficiency Law In California
- New California Anti Deficiency Law
- new California Foreclosure Civil Codes
- new california short sale addendum
- New California Short Sale Law
- New Deficiency Protection
- New Government HAFA Short Sale Guidelines
- new Government Loan Modification Programs
- new government program
- new government program that began on April
- new government short sale program; HAFA
- New Guidelines to HAMP
- New HAFA guidelines
- new HAFA program
- new HAMP rules
- new home-loan programs
- new homes
- new short sale law
- new short sale listings
- new Short Sale Program in California
- newest California Foreclosure Law
- Newest California Foreclosure Timeline Graph
- newest California Short Sale Anti Recourse Legislation
- newest changes to HAFA
- newest Government Anti Foreclosure Programs
- Newest Government Anti- Foreclosure Program; HAFA
- Newest HAFA Guidelines
- newest Short Sale law
- No Deficency after short sale
- no deficiency judgment on a HAFA short sale
- no lender recourse
- NO recourse and $3000 in relocation assistance to the borrower
- No Recourse on Short Sales
- NOD
- non recourse for short sales in californa
- non-HAFA short sale
- non-profit organization
- Non-Recourse in California
- nonprime mortgage market
- nonprime mortgages
- Notice Of Default
- Notice of Default is recorded
- Notice of default or NOD
- notice of defaults and notices of trustee sales in Folsom
- Notice of Trustee Sale
- notice of trustee sale california
- Notice of Trustee Sale Filings in Sacramento
- notice of trustee sale in California
- Notice of Trustee Sale is recorded
- Notice Of Trustee Sales
- Notice of Trustees Sale is recorded.
- notices of trustee sales in Folsom
- number of delinquent homeowners
- number of foreclosure Cancellations
- Oan Mod help
- Obama administration effort to boost short sales
- Offer on Sacramento short sale
- offer on short sale
- Official Disclosures Required in California.
- options available to homeowners
- options available to homeowners who find themselves underwater
- Options other than a Loan Modification
- Options To Foreclosure
- or any other Sacramento area
- or BPOs
- or lender is participating
- or Wells Fargo to find a Short Sale Specialist?
- Orangevale
- Orangevale Short Sale Approval
- Orangevale Short Sale Processing Team
- Orangevale Short Sales
- Orangevales' January short sale
- oreclosure options
- oreclosure Time Lines In Sacramento
- oreclosure Time Lines In Sacramento El Dorado and Placer Counties
- originated by Washington Mutual (WAMU)
- other foreclosure avoidance options
- over encumbered homes in Folsom
- P Morgan Chase
- paint and maintain your rusty natural gas and propane piping
- Participating HAFA Banks
- participating in HAFA .
- participating in the new government short sale program; HAFA
- partner first
- Paying Homeowners
- Pended Folsom Short Sales
- pended short sales
- pending foreclosure
- pending homes in Folsom
- pending short sale
- Pending Short sales
- Pending Short Sales in Citrus Heights
- Pending Short sales in El Dorado County
- pending short sales in Folsom
- Pending status
- percentage of Sacramento homeowners Upsidedown
- permanent modifications
- Permanent Modifications Increases 45%
- personal representative
- Personal Representative letter
- Personal Representative of an Estate
- Personal Representative on new probate filings
- PFC
- PFS Program
- Placer County and El Dorado County
- Placer County Short Sale Statistics
- Placer County time frames for foreclosure
- Placerville and El Dorado County Short Sale Information And Statistics
- Placerville Short Sales
- postpone the trustee sale
- pproved Short Sales in Folsom!
- Pre- Foreclosure Specialist Certification Logo
- pre-approved short sale
- Pre-Foreclosure Expert and Home Retention Advocate
- Pre-Foreclosure Sale
- Pre-Foreclosure Specialist
- preparing your home for sale.
- preparing your home for successful showings
- Price
- principal residence for HAFA
- principle reduction
- principle reduction in Folsom
- principle reductions
- Probate
- Probate court
- Probate Expert In Sacramento
- Probate In California
- Probate information
- probate is the legal process
- probate Personal Representative
- Probate process
- Probate Questions and Answers
- Probate Real Estate
- Probate Real Estate Consultant
- Probate Real Estate Expert In Sacramento
- Probate Real Estate Sales
- Probate Real Estate Specialist
- Probate Services.
- Probate Specialization Team
- Probate: Both a Process and A Place
- professional short sale specialist
- professional short sale specialist in Folsom
- Program May Allow Short Sale Homeowners To Stay
- prohibits any deficiency judgment
- projects
- property may sell in probate
- property sold short
- property-valuation fraud
- proprietary short sale program
- prospects for a short sale
- protect defaulted homeowners from deficiency
- protect homeowners from recourse
- protect short sellers
- PSC designation
- purchase money
- Purchase Money Loan
- purchase-money acquisition loan
- pursue deficiency judgments for the amount they are shorted in a short sale.
- pursue deficiency?
- qualifications for a short sale
- qualified for a short sale
- qualified for HAFA
- qualifry for a short sale
- qualify for a modification
- qualify for a short sale
- qualify for government short sale programs
- qualify for HAFA
- qualifying for hafa
- question about short sales
- Questions About Cash For Keys
- Questions About Cash For Keys with HAFA's Short Sale Program
- Questions About Foreclosure Time Lines In California
- questions about HAFA
- questions about short sale hardship letters
- questions about short sales
- Questions on government Short Sale Programs
- questions on Short Sales
- Questions On the HAFA Short Sale Program.
- Questions on your particular situation? Contact us today at Forth Hoyt's Sacramento Short Sale Center.
- quick projects that cost less than $300
- Quick Search Mello Roos
- Ramifications of a Short Sale
- RDCPro
- Real Estate
- real estate agent
- real estate agents
- real estate and internet
- Real Estate and the Internet
- Real Estate Data
- real estate equator system
- real estate market
- real estate market “shift”?
- real estate market beginning to shift?
- Real Estate Market In Sacramento
- Realtor
- reasons to avoid foreclosure
- reasons to do a short sale
- Recource on California Short Sales
- recourse
- Recourse and deficiency foreclosure and short sale rules
- RECOURSE LOANS IN SHORT SALE
- recourse rules in California
- reduce your home’s time on the market
- refinanced second mortgages can be full recourse
- Relocation Expense reimbursement
- remodeling investment
- remodeling investments
- remove the deed-in lieu from the report.
- REO inventory in Folsom
- Repairs with the Best return on investment
- repossessed by banks
- Required California Disclosure Documents
- Required Disclosures
- required short sale documents
- RequiredDisclosure Documents
- Residential homes
- risk of a short sale
- robate Estate Administration Process in California
- Rocklin
- Rocklin and Surrounding Areas.
- Roseville
- Roseville ca
- Roseville CA Area
- Roseville Certified HAFA Short Sale Specialist
- Roseville HAFA Certified Short Sale Specialist
- Roseville HAFA Extension and Update.
- Run the numbers
- S.B. 1178
- S.B. 931
- sac short sale help
- sacramenot certified short sale specialist
- Sacramenot Short Sale
- sacramenot short sale info
- Sacramenot Short Sales
- Sacrament short sale
- Sacramento
- Sacramento area
- Sacramento Area Bank America Short Sales
- Sacramento area Certified Pre-Foreclosure Specialist
- Sacramento Area Certified Short Sale Specialist
- Sacramento area CRS
- Sacramento Area Expert Short Sale Negotiator
- Sacramento Area Forclosure News
- Sacramento Area Foreclosure Activity
- Sacramento Area Foreclosure Specialist Report
- Sacramento Area HAFA Short Sale Expert
- Sacramento area HAMP loan mod success
- Sacramento area homeowner looking to short sale
- Sacramento area homeowners to stop foreclosures With Short a Short
- Sacramento area mortgage delinquencies
- Sacramento area Probate Real Estate
- Sacramento area Probate Real Estate Expert
- Sacramento area Probate Real Estate Experts!
- Sacramento Area Probate Real Estate Sales
- Sacramento area Probate Real Estate Sales Experts!
- Sacramento Area Probate Services.
- Sacramento area real estate market
- Sacramento area sellers Considering a Short Sale
- Sacramento area short sale
- Sacramento area Short Sale client
- Sacramento area short sale closings
- Sacramento Area Short Sale Expert
- Sacramento area Short Sale Expert Forth Hoyt
- Sacramento Area Short Sale help
- Sacramento area Short Sale relocation assistance
- Sacramento area Short Sale Specialist
- Sacramento area short sale transactions
- Sacramento Area Short Sales
- Sacramento Bank Of America Short Sale Experts
- Sacramento Bank Of America Short sale Relocation Assistance
- sacramento bank owned
- Sacramento CA
- Sacramento CA Certified HAFA Short Sale
- Sacramento CA HAFA
- Sacramento California area short sellers
- Sacramento CDPE Short Sale Expert
- Sacramento Certified Distressed Property Expert
- Sacramento Certified HAFA Short Sale
- Sacramento Certified HAFA short sale expert
- Sacramento Certified HAFA Short Sale Specialist
- Sacramento Certified HAFA Short Sale Specialist Forth Hoyt
- Sacramento Certified HAFA Specialist
- Sacramento Certified Pre Foreclosure Specialist
- Sacramento Certified Residential Specialist
- Sacramento Certified Short Sale Agent
- Sacramento Certified Short Sale and Pre-Foreclosure Specialist Report
- Sacramento Certified Short Sale And Pre-Foreclosure Specialist Reports
- Sacramento Certified Short Sale Specialist
- Sacramento Certified Short Sale Specialist and Expert Short Sale Negotiator
- Sacramento Certified Short Sale Specialist Reports
- Sacramento certified short sale specialists
- Sacramento County Forclosure filings
- Sacramento County Foreclosure activity
- Sacramento County Foreclosure TimeFrames
- Sacramento County Foreclosure Timeline
- Sacramento County Foreclosures
- Sacramento County Homes underwater
- Sacramento county short sale February HAMP report card
- Sacramento County Short Sale Statistics
- Sacramento County Trustee Auctions are held nearly every business day at 720 9th St. Sacramento
- Sacramento County Trustee Sale Location
- Sacramento Credit Counseling
- Sacramento Defaults
- Sacramento Expert HAFA Short Sale Agent
- Sacramento expert short sale agent
- Sacramento Expert Short Sale Negotiator
- Sacramento Foreclosure
- Sacramento Foreclosure News
- Sacramento foreclosure process time lines
- Sacramento Foreclosure Report
- Sacramento Foreclosure Specialist
- Sacramento Foreclosures
- Sacramento Foreclosures have been cut dramatically
- Sacramento HAFA agent
- Sacramento HAFA Certified Short Sale Specialist
- Sacramento HAFA Certified Specialists
- sacramento hafa expert
- Sacramento hafa short sale agent
- Sacramento HAFA short sale expert
- Sacramento HAFA Short Sale Relocation Assistance
- Sacramento HAMP
- Sacramento HAMP loan modifications
- Sacramento Home Buyers
- Sacramento Home Market
- Sacramento home prices
- Sacramento homeowner
- Sacramento Homeowners
- sacramento homeowners behind
- Sacramento Homeowners Facing Foreclosure
- sacramento homeowners stop making house payments
- sacramento homeowners stop paying
- Sacramento homes actually sold at the courthouse steps
- Sacramento homes in foreclosure
- Sacramento Housing Crisis
- Sacramento housing inventory
- Sacramento Housing Market
- sacramento investor short sael
- Sacramento is a strong Buyers Market!
- Sacramento is a very strong sellers Market!
- Sacramento loan modification
- Sacramento Loan Modification Help
- Sacramento Loan Modification Help From a Certified Foreclosure Options Expert
- Sacramento Metro Short Sales
- sacramento mortgages
- Sacramento Notice of Default Filings
- sacramento notice of trustee sale
- Sacramento Placer and El Dorado County Short Sale Statistics
- Sacramento Placer and El Dorado County short sales
- Sacramento pre-foreclosure specialist
- Sacramento Probate Assistance
- Sacramento Probate Assistance Center
- Sacramento Probate Real Estate
- Sacramento Probate Real Estate Help
- Sacramento Probate real estate information
- Sacramento Real Estate
- Sacramento Real Estate Data
- Sacramento Real Estate Decline
- Sacramento Real Estate Market
- Sacramento Short Sale
- SACRAMENTO SHORT SALE ADVICE
- Sacramento short sale advice and information
- Sacramento short sale agent
- Sacramento Short Sale Agents
- Sacramento short sale Cash For Keys Program
- Sacramento Short Sale Center
- SACRAMENTO SHORT SALE CENTER and wereheretohelp.org
- Sacramento Short Sale Center Presents
- Sacramento Short Sale Certified Specialist
- sacramento short sale expert
- Sacramento Short Sale Expert Report
- Sacramento short sale expert Sacramento county short sale expert HAFA 3000 to homeowners
- Sacramento Short Sale Expert Team
- Sacramento short sale fees
- Sacramento Short Sale Help
- Sacramento short sale help
- sacramento short sale help and info
- Sacramento Short Sale Homeowners
- Sacramento Short Sale Info
- Sacramento Short Sale Information
- Sacramento short sale listing agent
- Sacramento short sale Listing specialist
- Sacramento short sale negotiations
- Sacramento short sale numbers
- Sacramento Short Sale Pecialist
- Sacramento Short Sale Professional
- Sacramento Short Sale Sellers
- Sacramento Short Sale Specialist
- Sacramento short sale specialist agent
- Sacramento Short Sale Specialist Report
- Sacramento Short Sale Specialist Successful Again In Natomas!
- Sacramento short sale specialists
- Sacramento Short Sale Stats
- Sacramento Short Sale Strategies
- Sacramento Short Sale Success Rate
- Sacramento Short Sales
- Sacramento Short Sales are poised to increase further
- Sacramento Short Sales Increase
- Sacramento shortsales
- Sacramento Strategic foreclosure
- Sacramento Trustee Sales
- Sacramento Vacant Homes
- Sacramento who are upside-down
- Sacramento's Premier Short Sale Team
- Sacremto short sale approval
- save the commission
- SB 458 Extends Anti-Recourse Protections of SB 931 to Second Mortgages
- SB 931
- SB 931 Deficiency Protection
- SB 931 stops Deficiency Judgments on short sales
- SB 931 will protect from deficiency
- SB1178
- SB1178 Would Stop Deficency Judgements
- SB458
- SB931
- SB931 (Senate Bill 931)
- SB931 goes into effect in January
- SB931 Signed Into Law
- scenarios where a short sale is a perfect solution
- Schedule a home inspection
- Seasoned Short Sale Negotiator
- Second Lien Modification Program (2MP)
- Second Mortgage Recourse in California
- Section 7.3 of Chapter IV
- see if you can Short Sale on your Folsom home
- sell
- sell fast
- sell in probate
- Sell Quicker Every Time
- sell your home
- sell your home faster
- sell your home FASTER AND FOR MORE
- sell your own
- Sell Your own home
- Seller Disclosure Requirements
- Seller Financed Purchase Money
- Seller Stays In Home After Short Sale!
- SELLERS MARKET in Sacramento
- Selling a home in The Sacramento Area is a lot of work
- Selling a House in Probate
- selling for more
- Selling Inherited Property
- Selling Real Estate that is in Probate
- selling their own real estate
- Selling your home
- Selling your home in the Sacramento area
- Senate Bill (SB 458)
- Senate Bill 900
- senate bill SB931
- senior lienholder
- servicer's policies
- settle Estates quickly
- Seven Short Sale Mistakes
- SFR
- Shaper sale agent in Sacramento
- Shingle Springs
- Short
- Short sal my Folsom house
- Short Sale
- short sale a home in Sacramento
- Short Sale A triplex in North Sacramento
- Short Sale Addendum
- Short sale advice
- Short Sale Advice for Sacramento
- Short Sale Advisory and Addendum
- short sale after bankruptcy
- short sale agen network
- short sale agent
- short sale agent folsom
- Short Sale Agent Forth Hoyt
- short sale agent in el dorado hills
- short sale agent in folsom
- short sale agent in Folsom specialist
- Short Sale agent in Sacramento
- Short sale agent in the Folsom Area
- Short Sale Agent in the Sacramento Area
- Short Sale Agent listing the home
- Short Sale Agents Negotiation
- Short Sale Agreement
- short sale and foreclosure credit score differences
- Short Sale and Foreclosure Deficiency in California
- Short Sale And Foreclosure Tax
- Short Sale And Loan Mod Debt Relief Non- Taxable
- Short Sale and Pre-foreclosure designations
- Short Sale and Real Estate Law
- Short Sale and Stay Current!!
- short sale and stay in home
- SHORT SALE ANTI RECOURSE
- Short Sale Anti-Recourse Protections
- short sale approval
- short sale approval from bank of america
- short sale approval letter
- short sale approval letter from Bank of America
- Short Sale Approval Letters
- Short sale approval prices
- short sale approval sacramento
- short sale approvals
- short sale approvals (pended Short Sales) in Folsom
- Short sale approvals in El Dorado County
- Short Sale Approvals in Folsom
- Short Sale Approvals in Natomas
- Short Sale Approvals in Orangevale
- short sale approved
- short sale as an alternative to foreclosure
- short sale bank
- short sale buyer
- short sale buyers
- short sale Cash For Keys
- Short Sale Cash For Keys Program
- Short Sale Certification
- Short Sale Certification and Designation
- short sale closings are increasing
- short sale commission
- short sale commissions
- Short Sale Deficiency
- Short Sale Deficiency in California
- short sale deficiency language removed
- short sale deficiency law
- short sale deficiency letters
- Short Sale Definition
- short sale definitions
- short sale documents
- short sale education
- Short Sale Effects on Credit
- short sale escrows
- short sale escrows fail
- short sale expedite program Bank of America
- short sale expert
- Short Sale Expert and Certified Short Sale Negotiator
- Short Sale Expert Forth Hoyt
- Short Sale Expert Forth Hoyt; Folsom's
- short sale expert from Sacramento
- short sale expert in Folsom
- Short Sale Expert Negotiator and Certified Short Sale Specialist Forth Hoyt
- short sale expert sacramento area
- short sale experts
- short sale fees
- short sale fha mortgages
- short sale file
- short sale file management
- Short Sale Files on Bank America's Equator
- short sale flopping
- short sale flopping on the rise
- Short Sale Folsom
- Short sale Folsom expert
- short sale folsom help
- short sale forms
- Short Sale Fraud
- Short Sale Fraud on the Rise
- short sale guidelines
- short sale HAFA
- Short sale Hardship Letter
- short sale help
- Short sale help Folsom
- short sale help in sacramento
- Short Sale Holy Grail
- Short Sale Home
- short sale home in sacramento
- Short Sale Homes in El Dorado Hills
- Short sale how to
- short sale in Folsom
- short sale in sacramento
- Short Sale In The Sacramento
- Short Sale In The Sacramento Area
- Short Sale Incentive Program
- short sale incentive to seller
- Short Sale Info
- short sale information
- short sale information for Natomas
- short sale information for Sacramento
- short sale information in Sacramento County
- short sale information sacramento
- short sale is just like foreclosure
- short sale knowledge
- Short sale law Seller recourse for deficiency
- short sale lawyer sacramento for buyers
- Short Sale Lease Back
- Short Sale Lease Back Certified Specialist
- Short Sale Lease Back Program
- short sale listing
- short sale listing agent
- Short Sale Listing Specialist in Folsom
- short sale listings
- short sale listings in the Sacramento
- Short Sale Mistakes
- SHORT SALE MY FOLSOM HOME
- Short Sale Myths
- Short sale negotiating
- short sale negotiation
- short sale negotiator
- short sale negotiators
- short sale offer
- Short sale offer processing
- Short sale offer sacramento
- short sale on a house
- short sale on first mortgages
- short sale on investment property
- short sale or deed-in-lieu of foreclosure
- short sale or DIL
- Short Sale Outreach
- short sale outreach program
- Short Sale Package?
- short sale payoff demand
- short sale payoff letter
- Short Sale pendings
- Short Sale Pitfalls
- short sale proceeds
- short sale process
- Short sale Process and transaction
- short sale process folsom specialist
- Short Sale Processing
- short sale processing system
- short sale professionals
- short sale program
- short sale properties
- short sale purchase
- Short Sale Questions
- short sale real estate agent's fees may be deducted from the sale proceeds
- short sale recourse in California
- Short Sale Recourse Law In California
- Short Sale Recourse on second mortgages
- short sale reduce the damage to your credit
- Short Sale Relocation Assistance Program
- short sale relocation assistance?
- Short Sale Relocation program
- Short Sale Relocation program for California
- Short Sale Report
- short sale sacramento
- Short sale Sacramento info
- Short Sale Sacramento Real Estate
- Short Sale Seller Homeowner
- Short Sale Seller's Tax Break Ends
- Short Sale sellers
- short sale servicer
- short sale specialist
- Short Sale Specialist Agent
- Short Sale Specialist Forth Hoyt
- Short Sale Specialist Groups
- short sale specialist in Folsom
- short sale specialist in Sacramento
- short sale specialist in the Sacramento area
- short sale specialist sacramento
- Short Sale Specialist Successful In Natomas
- Short Sale Specialist Team
- Short Sale Specialists
- Short Sale Specialists in El Dorado Hills
- Short Sale Specialists in Folsom
- Short Sale Statistics
- Short Sale Statistics For El Dorado Hills:
- Short Sale Statistics for the greater Sacramento
- Short Sale Stats for Folsom
- short sale steps
- SHORT SALE STRATEGY
- short sale success rate
- Short Sale Tax
- Short Sale Tax And Loan Modification Tax Bill
- Short Sale team
- Short Sale Teams in Sacramento
- Short Sale terms
- Short sale timelines
- short sale training
- Short Sale Training 101 For Sacramento Area Homeowners
- Short Sale Training Certification!
- Short Sale Training For Sacramento
- short sale transaction
- short sale transaction requires exactly the same documentation
- short sale transactions
- Short Sale Transactions Still Aren't Closing
- short sale vs foreclosure in folsom
- Short Sale vs. Foreclosure
- Short Sale vs. Foreclosure? what are the benefits of a short sale?
- short sale with Wells Fargo
- SHORT SALE YOUR HOME WHILE STILL CURRENT
- short sales
- Short Sales After Bankruptcy
- Short Sales and Foreclosure law in California
- Short Sales and Foreclosures in California
- short sales and how that process works
- short sales approvals
- short sales are ever approved
- Short Sales Are Increasing
- Short Sales Can Keep Homeowners Out Of Foreclosure
- Short Sales closed
- Short Sales Explained
- short sales for my clients here in Folsom
- Short Sales Go Pending
- Short Sales going pending
- Short Sales going to foreclosure
- Short Sales in California
- Short Sales in Citrus Heights
- Short sales in El Dorado County
- Short sales in El Dorado Hills
- short sales in Elk Grove
- short sales in Folsom
- Short Sales in Natomas
- short sales in sacramento
- Short Sales in Sacramento are certainly up
- Short Sales in Sacramento are up
- short sales in the 95662
- Short sales in The El Doreado hills Zip Code 95762
- Short Sales In the Sacramento
- Short Sales In The Sacramento metro area
- short sales into pending status
- short sales on All HUD Properties.
- Short Sales On El Dorado Hills Luxury Homes
- short sales or foreclosures
- short sales or loan modification tax
- Short Sales Sacramento Placer And El dorado Counties
- short sales sold
- short sales that go into pending status
- short sales that have been approved
- short sales to non-profit organizations
- Short SaleTaxes
- Short Selling My Home
- short selling your Sacramento area home
- Shortsales
- Showing Your Home For Sale:
- showing your home to buyers
- significant benefits of doing a short sale in West Sacramento
- simple and no hassle help to get through a probate
- Single point of contact
- situation fits a short sale
- So How Does the HAFA Short Sale Program Help Me?
- Sold Short Sales in El Dorado County
- solution for your mortgage problem
- solutions when faced with foreclosure
- specialize in Short Sales
- specialize in Short Sales in Natomas
- Specialized Short Sale agent
- specialized short sale training
- speed up the short sale process
- SRES
- Start of foreclosure process
- State Mandated Disclosure Documents
- stay in the property
- Stay in their home
- Stay In Their Home After A Short Sale
- stay out of foreclosure
- stay out of foreclosure in folsom
- stay out of foreclosure in Sacramento
- Step By Step Loan Modification Directions
- step by step loan modification instructions
- Step By Step Loan Modification Tips
- step-by step guide to a Loan Modification.
- Step-By-Step Tips for your Loan Mod
- Stop Deficency Judgements
- stop deficiency judgments on short sales in California
- Stop foreclosure
- Stop Foreclosure With A Short Sale! Call A Short Sale Specialist!
- stop foreclosures With Short a Short Sale.
- stop the foreclosure sale
- stopping foreclosure
- stopping foreclosure with a short sale
- stops deficiency recourse
- straightforward straight - up offer to help you with your probate.
- Strategic Default
- Strategic Default in Sacramento
- strategic defaults
- Strategic Foreclosure
- Strategic Short Sale
- strategically default.
- strategically walk away
- strategy to stay in the home and avoid foreclosure
- Stressed Sacramento Homeowners Looking for Options
- STRONG SELLERS MARKET in Sacramento
- Struggling and Upside-down homeowners in Folsom
- struggling with mortgage payments
- struggling with mortgage payments in theSacramento Area
- subprime
- Successful HAFA Short Sale Nebotiator
- successful loan modification
- successful loan modification strategies
- successful short sale
- successful short sale agent
- successful Short Sale Business.
- Successful Short Sale in Folsom!
- successful short sales
- successful short sales in Folsom
- successfull short sales
- successfull short sales in Citrus Heights
- successfully complete a HAMP Trial Period
- successfully sell your home on your own
- Supplemental Directive 11-02
- sustaining modifications
- T D S
- Talk to a Short Sale Expert
- tax after foreclosure
- tax after short sale
- Tax due after a short sale?
- tax forgiveness on any mortgage relief
- tax liability from a short sale or deed-in-lieu
- tax on a loan modification
- Taxation After a Foreclosure
- Taxation After a Short Sale
- TaxCredit Reports After a Short Sale
- taxes on a California short sale
- taxes on forgiven mortgage debt
- taxes on in a short sale
- TDS
- temporary loan modifications
- temporary modifications
- that is correct…Bank of America has a short sale processing system built just for them that will completely and dramatically change the way they handle and process short sales…and it is powered by the
- THE 4 EARLY SIGNS OF MARKET CHANGES
- The 4 MOST IMPORTANT Measurements That Define a “SHIFT”
- THE 4 SIGNS OF MARKET SHIFTS
- the actual trustee sale at Sacramento county trustee sale at 720 9TH ST downtown Sacramento
- The authorization to release information
- The best real estate agents
- The California Homeowner Bill of Rights
- The California Homeowners Bill of Rights help protects homeowners
- The Chase Short Sale Incentive Program
- The HAFA Update And Extension And Extension
- The hardship letter
- The Hardship Letter- How important is it?
- The Homeowner Bill of Rights
- the hoyt group
- The laws and jurisdictions of Probate:
- The name Mello-Roos is derived
- the new government short sale program
- the new HAFA Government Short Sale Program
- The Notice Of Default
- THE QUALITY OF YOUR SHOWINGS
- The residential appraisal process
- The Short Sale Lease Back Program Has Been Approved
- The Short Sale Process
- The Short Sale Solution
- The Steps To Execute A Probate In California
- The Trick to selling fast?
- there is no deficiency for purchase money
- there is no deficiency judgment.
- thinking about a short sale in El Dorado Hills
- thinking about a short sale in Folsom
- Third Party Approval
- third party Short Sale approval
- three different HAFA program
- time for a foreclosure to be completed in Sacramento
- time for the foreclosure process
- time for the foreclosure process to be completed in Sacramento
- Time Line Chart for the Legal Non-Judicial Foreclosure Process in California
- Time To Foreclose
- Time to Foreclose in California
- time to foreclose in Folsom CA
- Time To Foreclose in Sacramento
- Time to Foreclose in Sacramento California
- Time To Foreclose In Sacramento County
- Time to foreclose in West Sacramento
- time to foreclose Sacramento
- time to foreclosure
- time to foreclosure in California
- time to foreclosure in Sacramento
- Time to Resell
- Timelines and Qualification Process
- timelines for California Foreclosures
- timelines for foreclosure in california
- tips and trick
- TOP
- TOP DOLLAR in the Sacramento
- top Folsom short sale agent
- top Sacramento area short sale Realtor
- top Short Sale Specialists
- Traditional Housing Affordability Index
- traditional short sales
- training for HAFA
- transaction handling technology.
- Transfer Disclosure Statement
- Treasurie's HAFShort Sale Cash For Keys: $3000 To The HomeownerA
- Treasury's HAFA
- Trendy Bathroom Designs for 2017
- trial HAMP loan modifications
- Troubled Asset Relief Program
- Troubled Sacramento homeowners
- trustee auctions
- trustee sale auction
- Trustee Sale Date
- trustee sale.
- Trustworthy Real Estate Agents
- Trying to buy a home
- typical short sale takes 2 to 4 months
- Unaffordable Mortgage
- understand foreclosure.
- understand HAFA
- understand short sales
- understand the short Sale Process
- understanding short sales
- Underwater and payment too high
- underwater mortgage
- underwater on their mortgages
- underwater Sacramento area homeowners
- up 141.3 percent
- up-front fees for HAFA short sales
- updated short sale documents
- Upside Down In Folsom
- upside-down Homeowners in Folsom
- upside-down on your Sacramento mortgage
- US Acronyms
- US Bank
- View and Downlaod
- VORECLOSURE TIME IN CALIFORNIA
- Wachovia
- wachovia hafa program
- well
- Wells Fargo
- Wells Fargo and Bank Of America Short Sales
- Wells Fargo delaying foreclosure sales
- Wells Fargo foreclosure sales or Trustee Sales
- Wells Fargo is participating in HAMP
- wells fargo participating in HAMP
- Wells Fargo short sale
- Wells Fargo Short Sale Assistance
- Wells Fargo Short Sale Dept.
- Wells Fargo Short Sales
- Wells Fargo to find a Short Sale Specialist
- wells fargo trustee sale postponements
- Wells Fargos's Short Sale Program.
- wereheretohalp.org
- wereheretohelp.org
- Wereheretohelp.org required disclosure documents
- West Sacramento
- West Sacramento Foreclosure
- West Sacramento Short Sale
- West Sacramento Short Sale Expert
- what Are My Options?
- What are recourse rules in california
- What are THE 4 SIGNS OF MARKET CHANGES?
- What are the best practices for setting up great showings
- What are the California Short Sale Tax laws
- What are the HAFA Eligibility Requirements?
- what are the newest short sale laws in California
- What are the signs of a drop?
- What Are The Steps To A Successful Loan Modification?
- what banks are in hafa
- What Banks Are Participating In HAFA?
- What Bills are in the California Bill Of Rights
- What can I compost
- What constitutes a hardship for a short sale?
- What Documents Are Required For A Short Sale
- What documents go in a short sale package
- What does compost do
- What does HAFA stand for?
- What does it take to stop a foreclosure
- What does it take to stop a foreclosure? How can you postpone a foreclosure sale date?
- what exactly is composting
- What Happens To Second Mortgage on a Short Sale?
- What if I have to move from Folsom and I'm upside down?
- What in the World Is HAFA?
- what information will the bank need and when do i need to send it to the bank?"
- what information will the bank need for a short sale
- What is a CDPE?
- What is a HAFA Short Sale
- What is a Hardship Letter?
- What is a Mello Roos District?
- what is a short sale
- What is compost
- what is composting
- What is Equator?
- What Is Going On With Orangevale Short Sales?
- what is HAFA?
- What Is HAFA? Can I qualify for HAFA?
- What is Mello-Roos?
- What is probate and where did it come from?
- What is Probate?
- What is Probate? Is there always a Probate? How does California Probate Work?
- What is the amount I may owe taxes on in a short sale
- What is the April Program?
- what is the benefit of a short sale
- What is the difference between an Executor and Personal Representative
- What is the foreclosure process
- What is the foreclosure process time line?
- What is the HA+MP/ HAFA Program? What about the Second Lien Modification Program (2MP) Or Home Affordable Refinance Program (HARP)
- WHAT IS THE HAMP/HAFA PROGRAM?
- What Is The New Short Sale Deficiency law In California?
- What Is The Short Sale Deficiency Law In California
- What is The Short Sale Process...
- What is the time to foreclose in California?
- what lenders participate with HAFA
- What Loan
- what makes a great real estate agent?
- What To Do If you Have A Second Mortgag
- what to know before you buy a home
- What Type of Home Loan
- What Type of Home Loan Should I Get?
- What's Different About a HAFA Short Sale?
- Whats The New Law In California Regarding Short Sales?
- When It's Ok To Walk Away
- where to get answers about hafa
- whether the bank has started foreclosure
- Which banks are in the HAFA program?
- Which Banks Are Participating In HAFA?
- Which Home Loan
- Which Home Loan is Best For Me?
- Which Loan You Decide
- Who are the HAFA participating banks
- Who can I ask about a short sale possibility?
- Who can tell me if I can short sell my Folsom House?
- Who Do I Ask If I Can Do A Short Sale On My Folsom House?
- Who Do I Ask If I Can Short Sale My Folsom House
- Who is the best short sale agent in Folsom
- Who Owns My Loan? Fannie Mae or Freddie Mac?
- who qualifies for HAFA
- who to ask about short sale possibility
- Why are El Dorado Hills Short Sales increasing?
- Why Avoid foreclosure
- why banks short sale
- Why Do A Short Sale
- Why does a Short Sale take so long?
- Why Isn't HAMP Working
- Why Not Foreclose
- Why Short Sale
- will a short sale affect my credit
- Will I have To Pay My Lenders Back After A Short Sale?
- Will the bank come after me if I short sell
- without naming a personal representative
- working on buying a home
- write an offer
- write the best hardship letter
- Your Guide to a Successful Loan Medication - Getting Your Lender to "Yes"
- Your Guide To a successful Loan Modification; Getting your Lender To "Yes"
- Your Mortgage
April 9, 2010
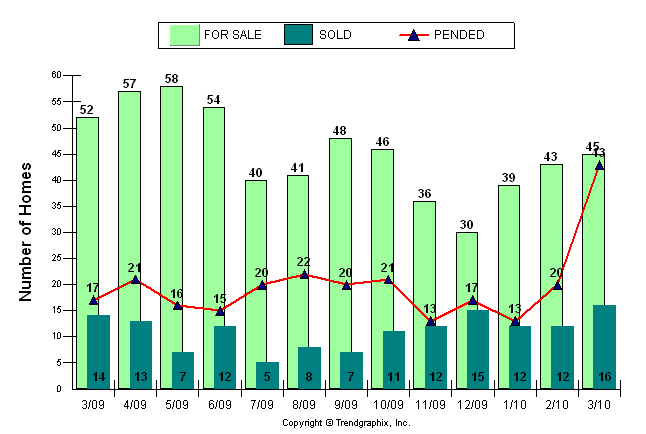
Below is a chart that goes with the above graph and reflects the drastic change in Approved Short Sales in Folsom! Folsom Short Sale Agents and […]
Do you like it?