More Folsom Short Sale information, Statistics and Short Sale Advice

Folsom Short Sale Stats 04 09 10 show dramatic increases in Folsom Approved Short Sales! And Pending Short Sales In Folsom!
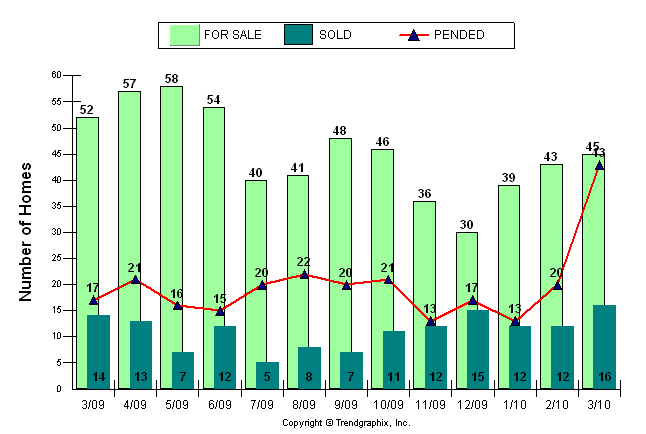
Below is a chart that goes with the above graph and reflects the drastic change in Approved Short Sales in Folsom! Folsom Short Sale Agents and Folsom Short Sale buyers and sellers should be celebrating!
| 1 month | 1 year | |||||
| Feb 10 | Mar 10 | % Change | Mar 09 | Mar 10 | % Change | |
| For Sale | 43 | 45 | 4.7% |
52 | 45 | -13.5% |
| Sold | 12 | 16 | 33.3% |
14 | 16 | 14.3% |
| Pended | 20 | 43 | 115% |
17 | 43 | 152.9% |
Do you have questions on your Folsom Home? Need to learn about your options? For a free, quick, over the phone or over the net consultation: Contact us Today At Forth Hoyt’s Sacramento Short Sale Center
More Folsom Short sale Stats
| Date | 3/09 | 4/09 | 5/09 | 6/09 | 7/09 | 8/09 | 9/09 | 10/09 | 11/09 | 12/09 | 1/10 | 2/10 | 3/10 |
| For Sale | 52 | 57 | 58 | 54 | 40 | 41 | 48 | 46 | 36 | 30 | 39 | 43 | 45 |
| New Listing | 16 | 26 | 17 | 16 | 20 | 24 | 27 | 26 | 14 | 21 | 21 | 22 | 32 |
| Sold | 14 | 13 | 7 | 12 | 5 | 8 | 7 | 11 | 12 | 15 | 12 | 12 | 16 |
| Pended | 17 | 21 | 16 | 15 | 20 | 22 | 20 | 21 | 13 | 17 | 13 | 20 | 43 |
| Months of Inventory based on Closed Sales | 3.7 | 4.4 | 8.3 | 4.5 | 8.0 | 5.1 | 6.9 | 4.2 | 3.0 | 2.0 | 3.3 | 3.6 | 2.8 |
| Months of Inventory based on Pended Sales | 3.1 | 2.7 | 3.6 | 3.6 | 2.0 | 1.9 | 2.4 | 2.2 | 2.8 | 1.8 | 3.0 | 2.2 | 1.0 |
| Absorption Rate based on Closed Sales | 26.9 | 22.8 | 12.1 | 22.2 | 12.5 | 19.5 | 14.6 | 23.9 | 33.3 | 50.0 | 30.8 | 27.9 | 35.6 |
| Absorption Rate based on Pended Sales | 32.7 | 36.8 | 27.6 | 27.8 | 50.0 | 53.7 | 41.7 | 45.7 | 36.1 | 56.7 | 33.3 | 46.5 | 95.6 |
| Avg. Active Price | 376 | 386 | 369 | 377 | 385 | 407 | 409 | 409 | 433 | 400 | 362 | 380 | 403 |
| Avg. Sld Price | 361 | 409 | 405 | 370 | 318 | 427 | 321 | 352 | 330 | 413 | 359 | 361 | 370 |
| Avg. Sq. Ft. Price | 178 | 173 | 172 | 183 | 186 | 160 | 183 | 179 | 171 | 168 | 176 | 179 | 162 |
| Sold/List Diff. % | 96 | 98 | 99 | 101 | 100 | 101 | 99 | 100 | 100 | 101 | 97 | 96 | 100 |
| Sold/Orig LP Diff. % | 86 | 91 | 95 | 97 | 92 | 92 | 89 | 96 | 95 | 96 | 93 | 90 | 91 |
| Days on Market | 136 | 188 | 53 | 101 | 127 | 77 | 193 | 176 | 131 | 95 | 147 | 129 | 137 |
| Avg CDOM | 153 | 254 | 102 | 114 | 206 | 115 | 193 | 191 | 152 | 148 | 147 | 145 | 150 |
| Median Price | 325 | 363 | 345 | 348 | 305 | 382 | 342 | 352 | 311 | 350 | 322 | 302 | 368 |

